Web analytics is the process of collecting, analysing, and interpreting data about website usage. Understanding the data will help you understand how visitors are using your website, and this is information that you can feed back into the design of your website.
To make the most of your website’s data it’s important to understand key terms like bounce rate, conversion rate, and sessions. Google Analytics is the most used by SMEs. Google Analytics 3 provides a lot of information about the way visitors use, interact with and move through a website. However, GA3 is highly reliant on tracking cookies, something that the EU have taken against on privacy grounds. As a result, at the time of writing, Google is in the middle of migrating from Google Analytics 3 (GA3) to Google Analytics 4 (GA4), a migration that is due to be completed by June 2023.
To help you understand the most important GA4 metrics here are 10 essential web analytics terms to get you started.
1/ Users
This is the count of visitors to your website within a specific time frame. The count starts when a visitor enters your website and ends when they leave, or after a period of inactivity, usually 30 minutes. Users numbers are important to understand, although it’s equally important to understand what they do whilst they are on your website and how long they stay on it.
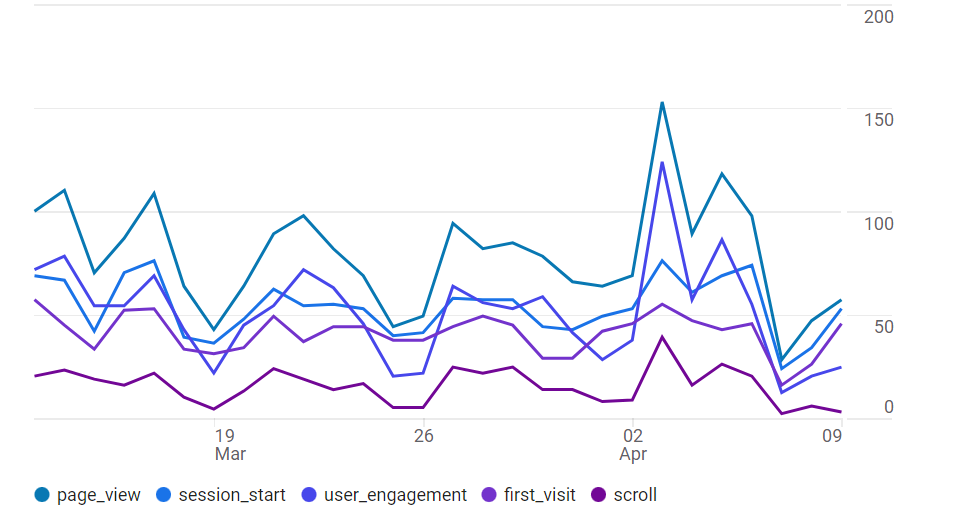
2/ Pageviews
A pageview is a count of the number of times a page on your website has been viewed. This metric is useful in measuring the popularity of your content and determining which pages on your site are the most engaging. Page Views divided by Users gives you an average number of Pages Viewed per visit, To get the full benefit of this metric you need understand what you want people to do whilst they are on your site, and how many pages they have tpo visit to complete that goal. Generally speaking, the higher the average number the better but if you have a small website it’s unlikely to be more than 2 or 3.
3/ New Users
Users is the count of the total of visitors to your website over a given period of time. A “New User” is a person who visits your website for the first time within a specific time frame. New Users are important to measure because this figure counts how many different individuals are visiting your website, which is crucial in determining the success of your marketing efforts.
4/ Engagement Rate

The Engagement Rate records the number of people who actually do something when the visit your website. In GA3 the Bounce rate was the percentage of visitors who left your website after only viewing one page, the Engagement Rate is a more positive view, looking at visitors who do something. Visit another page, watch a video, spend more than 20 seconds on your site etc.
A low Engagement rate can indicate that your website is not meeting the expectations of your visitors, and they are not finding what they are looking for.
5/ Conversion Rate
Conversion rate is the percentage of visitors who complete a specific action on your website, such as filling out a form or making a purchase. This metric is crucial in measuring the effectiveness of your website in achieving its goals. However, to be of value you must understand what it is you want your visitors to do and set the correct Goal in the “Conversions” screen.
6/ User Acquisition
This information helps you to understand how your visitors reached, or found, your website. Is your online advertising working? Are your Social Media campaigns delivering visits to your website? Is your SEO paying off?
The “User Acquisition” menu answers these questions, and more – such as which traffic source delivers the best Engagement Rate.
Core metrics include
- Direct – Visitors who know your web address, from their “favourites”, from a business card, from a phone conversation etc.
- Organic Search – Visits that started on a Search Engine, such as Google, Bing, Yahoo, DuckDuckGo etc.
- Paid – Traffic from Pay-per-Click Ads, such as Google and Bing Ads, Facebook Ads etc.
- Referral – Visitors that have arrived after clicking on a link on a third party site, such as a directory site
- Organic Social – Visitors who come from a Social Media platform, from clicking on your profile or something in your Newsfeed not after clicking on an Ad.
7/ Average Engagement Time
Time on site is the average amount of time that a user spends on your website. This metric is important in understanding the engagement level of your visitors and how interested they are in your content. LIke a lot of the metrics here, it does mean that you have to understand your website and website goals. How long does it take to get from the Landing Page to your goal page. For a small site, with just a Home Page and a Contact Page this could be a matter of a few seconds whilst for a larger, eCommerce website for example, it could be several minutes but understanding your website is key to properly understanding the Average Engagement Time.
8/ Landing Page
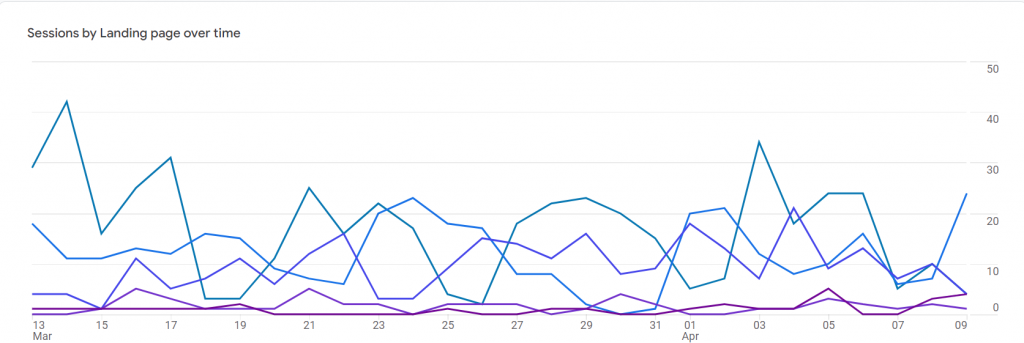
Contrary to popular belief, not all Visitors will land on your website’s Home Page. Search Engines will want to provide searchers with a link that is most appropriate to their search, for example. This makes it easier for searchers to find what they are looking for.
A well planned Ads campaign will take people directly to the page or product that most closely relates to their search.
People may also save specific pages in their Favourites.
Understanding Landing Pages and Engagement Rates for Landing Pages will enhance your understanding of the performance of your website.
9/ Tech >Device

These days, Google search takes a Mobile First view, which means it looks at the Mobile version of your website first. However, it’s important to understand how many visitors to your site come from mobile phones, desktops and tablets because this will guide you as to the most important format for your website. For example, if only 5% of visits come from Mobile devices then you need to focus on the Desktop/Laptop version of your website but if more than 30-40% of visits originate from mobiles then you need your prime focus to be on the small screen versions of your website.
10/ Demographics/User Location

It is important to understand where your visitors live. If you are an exporter you need to know that people in your target markets are finding, and visiting your website and if you only trade in the UK it’s important to ensure that the majority of your Visitors come from the UK. If you receive a lot of visits from territories that you don’t serve it might be that your marketing is being sown in countries that you don’t serve and this is wasted effort and wasted money, especially if you are using paid advertising to attract people to your site.
Conclusion
Understanding these ten essential web analytics terms is crucial in optimizing your website, measuring its effectiveness, and making data-driven decisions. By analysing these metrics, you can gain valuable insights into your website’s performance and can make changes that can lead to increased traffic, engagement, and sales.
I hope this list of terms is helpful and if you need help understanding what Google Analytics is telling you about your website, whether that’s GA3 or GA4 then please, don’t hesitate to get in touch. Call me on 01793 238020, email andy@enterprise-oms.co.uk or just search Chief SEO Officer